In other words, graphing time of day versus date in python.
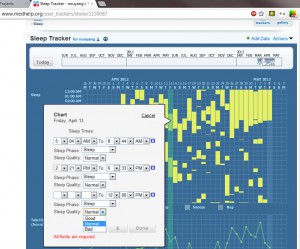
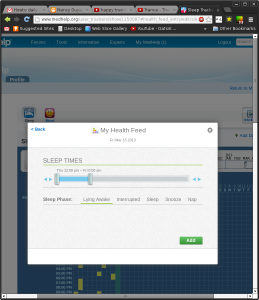
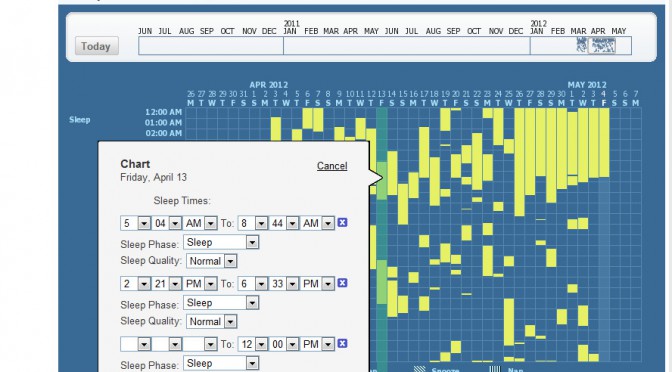
This morning I logged on to medhelp.org only to see that it had gone from somewhat usable for my purposes:
 |
| from my previous post, http://www.orangenarwhals.com/?p=129 |
where I can at least type in the times to some extent, even if there is no batch input (e.g. uploading a text file), to
 |
| wtf is this? i am clearly not in their target demographic… |
So I decided to get up off my lazy butt and do some python plotting.
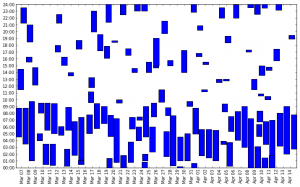
This is the end result:
(it’s flipped, so time increases going upward like you would expect a graph to do but opposite of how you would read the medhelp graph, where time increases going downwards, which I feel makes more intuitive sense).
The code is here:
https://github.com/nouyang/sleepgraph/blob/master/graph.py
I keep track of my sleep in a google doc that I just downloaded as a csv file. See the github repo.
===
brain/linkdump as i was working out how to do this
===
http://stackoverflow.com/questions/5498510/creating-graph-with-date-and-time-in-axis-labels-with-matplotlib
http://stackoverflow.com/questions/2369492/generate-a-heatmap-in-matplotlib-using-a-scatter-data-set?rq=1
http://stackoverflow.com/questions/8973846/how-do-i-create-this-kind-of-grid-table-using-matplotlib?rq=1
http://blog.brianhouse.net/post/6877602920/an-activity-heatmap-from-fitbit-data
http://stackoverflow.com/questions/4790265/plot-time-of-day-vs-date-in-matplotlib
vlines
http://matplotlib.org/api/pyplot_api.html#matplotlib.pyplot.vlines
can set line width but the plot does not adjust to this (how to pad the dates out so the lines won’t ever overlap?)
unix time
http://www.epochconverter.com/
bar plot
http://matplotlib.org/api/pyplot_api.html?highlight=pyplot%20bar#matplotlib.pyplot.bar
http://stackoverflow.com/questions/5902371/matplotlib-bar-chart-with-dates
now just need to adjust so not height, but also have start time
x = ‘3/18/2013’
datetime.datetime.strptime(str(x),’%m/%d/%Y’)
x = 1365739200
datetime.datetime.fromtimestamp(x)
# datetime.datetime(2013, 4, 12, 0, 0)
http://matplotlib.org/api/pyplot_api.html?highlight=pyplot%20bar#matplotlib.pyplot.bar
http://matplotlib.org/api/axes_api.html?highlight=xaxis_date#matplotlib.axes.Axes.xaxis_date
http://matplotlib.org/api/dates_api.html#matplotlib.dates.DateFormatter
dates.DateFormatter(‘%B %d, %Y’) # January 16, 1970
format: http://linux.die.net/man/3/strptime
http://stackoverflow.com/questions/886716/controling-bars-width-in-matplotlib-with-per-month-data
http://datadebrief.blogspot.com/2010/10/plotting-sunrise-sunset-times-in-python.html
okay, this solves the y-axis problem! excellent.
http://docs.scipy.org/doc/numpy/user/basics.io.genfromtxt.html
In particular,genfromtxt is able to take missing data into account, when other faster and simpler functions like loadtxt cannot
does not deal well with quotation marks in data
“Line #31 (got 8 columns instead of 7)”
24:00 –> 0:00:00 else
ValueError: time data '3/18/2013 24:00:00' does not match format '%m/%d/%Y %H:%M:%S'
also does not like 0 instead of 0:00:00


