I have decided to do a non-technical braindump. The main themes will be “brain, you are weird,” “strange corners of the internet,” and “f* constantly trying to figure out if I’ll be making people uncomfortable.”
What I have been thinking about:
- I’ve possibly become sexist against guys.
I really am trying hard to help it. I am taking a new class, D-Lab Education, which is all “haha yay educational theory oh yes by the way you are teaching a class in two weeks” which is all sorts of bats* nerve-wracking for me. I walk into the classroom and all I want to do is be like, “girls, science is awesome. f* yea I’m a female engineer studying at MIT” and ignore the boys. Which is all sorts of problematic, because boys have all sorts of their own educational issues as well. I just… don’t care enough about those issues. Maybe someday in the future.
There’s like TED talks about it (that I don’t think I’ve watched…) and in D-Lab education the topic itself has come up. The lady founder of the Kasiisi program mentioned briefly how it’s actually very difficult to get grants to work with boys. The basic summary was
- Girls start dropping out when they are old enough to get pregnant. Attendance-wise, one easy fix that actually seems to work is providing menstrual stuff.
- ~ (JPAL, which does actual rigorous testing, says otherwise, at least for girls in Nepal)
- Guys start dropping out when they are old enough to contribute to household income (tending the livestock)
- ~ The fix for this is creating income-earning opportunities, not an easy fix
She mentioned that uneducated and illiterate men is problematic for women as well when men have the upper hand in society, and that she’s thought about figuring out ways to co-found programs for men because everyone wants to fund women-oriented programs.
Of course, the other half of the time I’m sulking because I’m like, wtf, these kids living next to northeastern universities are so lucky. One of the reasons why I haven’t really volunteered with HSSP (high school studies program) or Edgerton Center is because I’m envious of these kids. Again, brain, weird, illogical.
Also, going back to elementary school, although I honestly don’t remember much of it, is bittersweet and kind of strange. Now that I’ve actually met these kids face-to-face it’s hard to back out on them, though. Uweh, what did I get myself into?
Resource links (our partners are learning about the water cycle)
http://ocw.mit.edu/high-school/
http://www.doe.mass.edu/frameworks/scitech/1006.pdf
https://www.engineeringforchange.org/solution/library/viewAll/Water
- Education
It’s the new thing, just as last year health and quantified self started coming to the forefront. You can tell by the creation of new hackathons around the topic:
http://www.edudesignathon.com/
and the Yunus challenge this year is education:
http://web.mit.edu/idi/yunus_2013.htm
One of the MIT Media Lab fellows is an “open education advocate” (and there’s a “maker movement advocate” too!)
blog.media.mit.edu/2013/01/please-welcome-our-new-directors-fellows.html
Also, did you know there is a hands-on online learning task force at MIT? Haha.
https://wikis.mit.edu/confluence/display/mensetmanus/2013-02-21+Task+Force+Meeting
The hands-on-online-learning-task-force at MIT (MIT certs required), an incredible linkdump.
(towatch: http://www.media.mit.edu/events/2011/10/26/john-maeda-stem-steam)
- Feminism
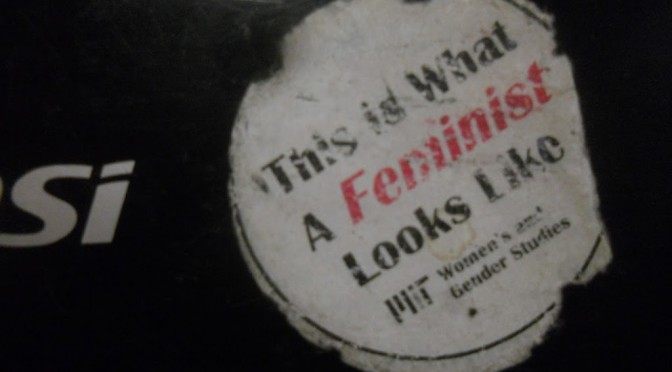
Speaking of misconceptions and preconceptions, two years ago I was asked point-blank if I was a feminist and I politely demurred. Srsly. I had no idea what feminism was (equality). I’ve since educated myself (well, it’s an ongoing process).
 |
| MIT Women’s and Gender Studies handed these stickers out last year. It’s my laptop decoration ^__^ |
- constantly having a slighty sore heart from all the news (linked is amherst, the latest flurry from the oscars/seth mcfarlane, Quvenzhané Wallis, bingo from australian-diaspora).
- wondering if it hurts my chances of being hired if I ask how many female engineers there are in a company (rather interesting to hear this speaker from etsy say that it’s probably a good sign if the company is actively trying to address this issue: http://www.adafruit.com/blog/2013/02/07/how-etsy-grew-their-number-of-female-engineers-by-500-in-one-year/)
- constantly trying to figure out how to ensure i’m serving as a good example as a technically competent female (am I being assertive enough? asking for enough salary? am I actually competent?)
- ~ 4th grade science: you learn there’s no real room for modesty. The answer to “Do you go to MIT?” is not “Erhm maybe yes, you probably know more than me though!” but rather “F* yea I go to MIT and am in love with engineering.” srsly. That last part has gotten buried under gunk lately.
I feel a bit silly sometimes, complaining like this, since I think I’m actually a pretty lucky person (see: #firstworldproblems). Compared to the issues I imagine underrepresented minorities facing, mine seem pretty minor. But I guess I may as well complain 😀 And it threw me for a loop the other day when I realized that some people may never have experience having family members looked down upon (and worse) for not speaking perfect English. -__-
Uhm. A longer post to come.
Actually nah I probably won’t get around to it, so basically, what’s been sucking up my spare time over the summer (well, half of it) and I’ve been trying to move away from (because clearly to be successful I need to spend all my spare time reading about robots, not feminism… or something…).
linkdump (wherein, if you read nothing else, read the first two links)
estimated time to read through this: a weekend.
rape culture
http://captainawkward.com/
I’m not slithering around on the floor and hissing with my forked tongue when I say that the situations described in these two letters are pretty good examples of what Rape Culture is and why it is so insidious.
Step 1: A creepy dude does creepy, entitled shit and makes women feel unsafe.
Step 2: The women speak up about it to their partners.
Step 3: It gets written off as “not a big deal” or “he probably didn’t mean it” or “he’s not a bad guy, really.”
http://yesmeansyesblog.
Reporting and conviction rates for acquaintance rapes are so low as to be useless as a diagnostic tool. And how else can we know? The rapists won’t just tell us that they are rapists, right? That’s what I would have thought. Turns out I thought wrong.
…
These 76 men, just 4% of the sample, were responsible for 28% of the reported violence. The whole sample of almost 1900 men reported just under 4000 violent acts, but this 4% of recidivist rapists results in over 1000 of those violent acts.
schrodinger’s rapist
http://kateharding.net/2009/
Do you think I’m overreacting? One in every six American women will be sexually assaulted in her lifetime. I bet you don’t think you know any rapists, but consider the sheer number of rapes that must occur.
http://freethoughtblogs.com/
http://scienceblogs.com/
http://scienceblogs.com/
careers
http://blogs.wsj.com/juggle/
why is it up to the disadvantaged to “fix things” (not get raped,…
http://9gag.com/gag/5674046
http://www.orangenarwhals.com/wp-content/uploads/2013/03/tumblr_md8wgiOrdH1qf66ono1_1280-300×218.jpg
http://feministing.com/2012/01/12/new-men-can-stop-rape-ads-rock/
… learn to be more assertive) anyway
http://www.career-intelligence.com/management/Seven-Myths-About-Getting-Ahead.asp
http://navigatingcultures.com/blog/?p=1125
And I think it’s this: teaching women to be more assertive and agressive in speaking up and asking for stuff is all well and good, and it will certainly help women be more successful in a man’s world – but it’s yet another example of how women must adapt to men to get ahead. Why is it never the other way around?
college
http://amherststudent.amherst.
http://www.quora.com/Rape/
MIT
http://whiteelephant.scripts.
http://saturdaynightatmit.
sweet talks
http://www.adafruit.com/blog/
data visualizations
http://www.remappingdebate.
vending machines
http://thinkprogress.org/
hacks
http://www.baltimorefishbowl.
and hackathons
http://www.fastcompany.com/
and how confusing it can be to figure out what is the “right thing to do” (my conclusion: go forth and get something done, then worry about learning about how you f*d it up)
http://kafila.org/2013/02/20/dear-sisters-and-brothers-at-harvard/
http://hcwc.wordpress.com/2013/02/15/a-history-of-violence/
and then a brief note
http://blogs.discovermagazine.com/notrocketscience/2010/11/25/15-minute-writing-exercise-closes-the-gender-gap-in-university-level-physics
- Startups*
http://www.cbsnews.com/8301-505143_162-47140168/are-startups-better-as-single-gender-affairs/
Let me be clear: This post is not “lifestyle businesses.” A lifestyle business and a startup are two totally different things. A lifestyle business grows slowly, the founder has total control over it, and it creates a nice life.
(hrm, I am mulling over this one).
* many of my friends at MIT have an allergic reaction to the word “startup,” which is curious
for myself, female CTOs / startup founders i should follow:
http://www.forbes.com/sites/women2/2012/08/10/female-founders-of-tech-startups-with-solid-technical-chops-own-it/
and some
resources at boston/MIT:
http://www.startlabs.org/resources
http://entrepreneurship.mit.edu/fsa
http://dogpatchlabs.com/about/
in general
http://lsvp.com/summer-fellowships/
http://summer.hcp.com/
china
http://www.haxlr8r.com/
makeplus.org
http://www.bunniestudios.com/blog/?p=2816
- Open source hardware
Holy hexapods! The open hardware summit is going to be held at MIT next year and will be hosted by MITERS. I am super-excited about this 🙂
Anyway, my latest cynical attitude is a sort of wait-and-see on the potential for open source hardware, where really I am affiliating myself with it because the people who associate with OSH tend to be cool people.
todo: http://www.oshwa.org/sharing-best-practices/
- Jobs
Things I’ve learned: R&D jobs are highly coveted in the engineering world (and looked upon more highly than jobs about manufacturing, which I am actually pretty fascinated by).
CS jobs start out high nowadays but have “salary compression,” wherein you start at 100k and might climb to 150k after 5+ years, while more hardware-oriented jobs tend to start lower and end higher.
(not much comfort to me, but whatever)
Hardware startup jobs: there really isn’t a search engine for this. There’s like… a small listing. http://www.adafruit.com/jobs/
Finding jobs with a laser-cutter: actually turns out to be the large companies, not the small hippie startups.
- lasercutters
Uh… more on this later, but cool interface:
http://www.wired.com/design/2012/11/whittling-with-lasers/
and the 2d-3d transition:
http://www.wired.com/design/2013/02/laser-origami/
==
Uh…. so yea…. that’s what’s been coming out of my brain lately.

